23 Posts from July 2011
- Jul 29, 2011 Posted By: Livio Di Matteo Tags: crisis, debt ceiling, resolution, united states
With the political situation in the United States still seemingly unable to resolve the debt ceiling issue, what will happen on August 2nd? I think there are three possibilities as to what will happen. First scenario, the debt impasse will be resolved in the wee hours just prior to August 2nd and a compromise reached that will raise the debt ceiling along with a combination of tax increases and expenditure reductions. Second scenario, there will be no political compromise and on August 2nd, President Obama will use his powers as President to safeguard the republic and an interpretation of Section 4 of the 14th Amendment to unilaterally raise the debt ceiling. Third scenario, there will be no solution reached effective August 2nd and the United States Federal Government will begin a process of shutdown similar to what just occurred in Minnesota. This will not be a debt default because apparently the next payment on the debt will not be due til about mid-August. The shutdown will free up the needed funds to service the debt averting default but at the cost of cuts and service reductions which will generate political mayhem. This may provide the necessary political environment and incentives to finally reach a compromise in the week or two after August 2nd.
The First Scenario is unlikely given the political entrenchment on both sides and the failure to reach a compromise to date. The Second Scenario is even more unlikely as it would require a degree of personal political fortitude that President Obama has yet to demonstrate. President Obama is more interested in being a friendly communicator than in being a heavy. At the same time, this may provide him the opportunity for more assertive leadership and if done successfully could politically cement him a second term. The Third Scenario is in my opinion probably the most likely of the three. Once actual shutdown of government functions occurs and people stop receiving social security cheques or other services, there will be a more direct political uproar that should create the necessary political pressure to resolve the situation.
The whole situation is quite remarkable given the wealth of the United States. After all, the United States is not Greece. The United States needs to do three things. First, raise the debt ceiling to deal with the immediate situation. Second, come up with a plan to balance their budget over the next three to five years with a combination of tax increases and expenditure cuts. Third, use some of the revenues from the increased taxes to set up a national infrastructure program to kickstart economic activity and restore consumer confidence and get their economy growing
For Canadians, we should be concerned given that all the uncertainty could place additional upward pressure on our dollar, which would hurt our export sector and harm our already weak recovery. It is going to be an interesting weekend.
Statistics Canada released some rather ominous data when it announced that real gross domestic product decreased 0.3% in May, after no change in April and a 0.3% increase in March. The mining, oil and gas extraction sector was the main source of the decline in May, though manufacturing and construction also fell. On the other hand, wholesale and retail trade, the public sector, utilities as well as the finance and insurance sector increased. This does bode poorly for the total second quarter results - April, May and June - and unless June compensates, we may see a quarter of negative growth the next time the growth figures are announced. Output growth has apparently been hampered by weather - oil and gas extraction in Alberta were affected by wildfires. On the other hand, the 2011 Census has helped boost federal employment and public sector output growth. Overall, I think its still too early to say the economy is slowing but watch out for spillover from what is going on in the United States if the debt ceiling impasse drags on and the value of our dollar continues to rise. Slow U.S. GDP growth figures recently released are also a poor portent for our economy.


- Jul 27, 2011 Posted By: Livio Di Matteo Tags: canada, distribution, inequality, wealth
Along with my academic research work in health economics and regional economic history, much of my research has focused on wealth in the nineteenth century and the analysis of probated estate wealth data. When the distribution of wealth in the nineteenth century is compared to today, it can be seen that inequality was generally higher then. However, what is interesting is that over time, the share of wealth held by the bottom forty percent of the wealth distribution has remained essentially unchanged. The poor, it would seem, are always with us. Visit my most recent post on Worthwhile Canadian Initiative to read more on this topic.
- Jul 27, 2011 Posted By: Livio Di Matteo Tags: economy, resilience, thunder bay
Winnipeg Free Press - PRINT EDITION
By: Livio Di Matteo
THUNDER BAY -- Northwestern Ontario's forest sector crisis was a regional economic shock that resulted in massive employment losses and yet its major centre -- Thunder Bay -- has shown remarkable resilience.
Thunder Bay itself saw three out of four paper mills close and numerous sawmill job losses over the last decade, resulting in an employment decline of about 10 per cent from its 2003 peak.
Thunder Bay has yet to recover the employment losses of the last decade but there is evidence of a transitioning economy and growing economic activity. Despite its past dependence on the forest sector for much of its employment, Thunder Bay is adjusting and positive economic change is underway.
Building permits in Thunder Bay are showing an upward trend and the total value of building permits in 2010 increased 44 per cent over 2009.
Housing prices in Thunder Bay are also healthy and are on a pronounced upswing despite the forest-sector crisis. Since 2003, the average MLS housing price in Thunder Bay has risen from $111,927 to $153,800 in 2010 -- an increase of 37 per cent but still very affordable by Canadian standards. Another indicator is the passenger volume of the Thunder Bay International Airport, which, as the regional airport, services all of Northwestern Ontario. Since 1998, passenger volumes have increased by 30 per cent and indicate that despite the forest sector downturn there is still growing demand for air travel to and from the region.
Another positive indicator is population growth. According to recently released Statistics Canada data, as of July 1, 2010, Thunder Bay's CMA population was 126,683, which represents a 3.1 per cent increase from the 2006 census figure of 122,907.
The resilient economy in Thunder Bay is being driven by three forces: the transition toward a knowledge-based economy, expenditure on public-sector infrastructure and the growth and development of the mining sector in the region.
The new knowledge economy is focused on the Thunder Bay Regional Health Sciences Centre, the Northwestern Ontario School of Medicine, and the research work of the Thunder Bay Regional Research Institute.
The recent acquisition of a new law school by Lakehead University represents a further deepening of the city's knowledge sector.
With respect to public-sector infrastructure, the region has seen millions of dollars in provincial road construction and improvements as part of a planned $273-million investment in regional highways, including a major highway upgrade project just east of Thunder Bay.
As well, there is a new courthouse under construction, a waterfront development project, substantial recent investments in city roads and bridges, a new library and recreation trail development.
This public-sector construction is being complemented by retail expansion in the Intercity area as well as some proposed new hotel projects.
While retail expansion in Intercity was traditionally seen as detrimental to the former core areas of Port Arthur and Fort William -- what Thunder Bay was before amalgamation in 1970 -- that, too, is changing.
Port Arthur's core is now being promoted as a tourism-entertainment core with a theatre, casino, waterfront development and a possible location for a new events centre arena complex.
Fort William is now the location for government services with city hall, a new regional services board headquarters and the new courthouse. After decades of rivalry, it would appear the former twin cities are finally learning to share and build on their strengths.
Finally, there is Thunder Bay's growing role as a mining service centre as well as the projected developments in the Ring of Fire, an area in the James Bay lowlands that is the subject of intense mining exploration.
Mining in Northwestern Ontario currently employs several thousand people and much of the equipment and supply needs are being met out of Thunder Bay.
Moreover, the long-term potential of the Ring of Fire is enormous given its potential supplies of nickel, copper, zinc, gold, chromite and palladium. While the full potential of the Ring of Fire is still a decade away and hinges on competitive electricity prices and infrastructure investment, it is nevertheless a source of hope.
Thunder Bay's economy is not out of the woods yet and its recent performance does present a paradox.
On the one hand, population is growing, there is a plethora of new construction activity, and housing prices are rising. Yet total employment remains flat.
Given the economic trauma of the last decade and the slow process of recovery and transition, new employment creation has yet to overcome the losses of the forest-resource sector. However, with a sustained economic recovery underway in the city and region, one can expect to eventually see employment levels pick up.
Livio Di Matteo is professor of economics at Lakehead University.
Republished from the Winnipeg Free Press print edition July 27, 2011 A10
- Jul 25, 2011 Posted By: Livio Di Matteo Tags: art, city council, humour, thunder bay
Thunder Bay City Council has approved spending just over 900,000 dollars on artwork for the city's redeveloped waterfront that will consist of twin 21 meter steel structures with a programmed LED lighting system and sound system that will broadcast whispers narrated by locals. These beacons have generated a fair amount of controversy as any public art is bound to do especially given what is perceived by many to be a rather hefty price tag. The artist's rendition (see photo below) of what the beacons will look like does evoke a rather futuristic polished steel type vision at least to my eyes and does seem to be a bit at odds with the rugged natural landscape of Superior's shore.

Moreover, the idea of having "whispers" emanate from the Beacons seems to clash with the natural sound of the waves pounding the rocks and on foggy evenings might be positively spooky. Still, art is in the eye of the beholder and the first sign of good public art is that it does generate discussion and controversy and this certainly fits the bill. As for the price tag, well that is an interesting fiscal issue and if these beacons represent value for money is something ratepayers will have to deal with come the next municipal election.
Of course, these beacons will eventually need to be named. Just as the two lions marking the New York Public Library got names, so must these beacons and the names must reflect the "Duality" on which the artistic design is based. Perhaps, Arthur and William would be good names, symbolizing the past of the twin cities. For more local flavor, how about Neebing and Paipoonge? Or, if we want to commemorate the more recent past, perhaps naming them Keith and Bob in honour of our current mayor and past police Chief. Two beacons standing on separate piers evoking how they are forever together yet forever apart, all the while pulsating flashes of light and color at each other and then whispering off into the night. I eventually see a civic beacon naming contest coming with three choices designed to split the vote - a Thunder Bay tradition.
Ultimately, City Council, probably sees these beacons as lighting up the future with hope. I think they can be interpreted as fulfilling an intense subliminal desire to obtain guidance and direction to deal with the burdens of office. Whenever City Council is in a fog and unable to reach a decision, the Beacons will pulse on the waterfront through rain, snow and sunshine illuminating the path to the waterfront and all the great things that can be accomplished at taxpayer expense. They will prove an inspiration to us all. On particularly difficult issues, councilors can wander to the base of the beacons and await the direction of the whispers which will serve as a new oracle. What will the whispers be? "If you build it they will come..." "Raise taxes..." "Parking is important to the public..." "Your people love you..." "Its cold out here..." etc...
Of course, if City Council is simply looking for guidance and direction, they are always welcome to visit with Northern Economist. Northern Economist is always ready to help point the way ahead and it won't cost you $904,000.

Northern Economist is looking ahead.
- Jul 22, 2011 Posted By: Livio Di Matteo Tags: employment, ontario election, regions
As Ontario moves into the fall provincial election campaign, the economy will definitely be a major issue. One important measure is job creation which can be estimated by looking at the level of employment. I've taken monthly employment data for Ontario from Statistics Canada. This monthly data is a 3-month moving average, unadjusted for seasonality. I've taken January 2005 as the base value of 100 and constructed an index of monthly employment from January 2005 to June 2011. It is plotted in the graph below and despite monthly fluctuations, generally shows a rising employment trend from 2005 to 2008, a decline due to the recession after 2008 and then a rising trend starting in early 2010 which has continued. It would appear that employment now is approximately where it was prior to the recession. Moreover, employment in Ontario June 2011 is about 8 percent higher than it was in January 2005.

The recovery from the recession should bode well for the incumbent Liberals in Ontario but Ontario is regionally diverse and when the same calculations are done for the major economic regions, it would appear that not everyone has shared in the jobs recovery. The graph showing monthly employment over time for the regions is a bit busy but downward trends are noticeable for a number of regions - particularly the Northwest.

A clearer picture emerges if one simply looks at the overall change over time by region as in the bar graph below. If one looks at the percentage change in employment from start to finish, one can see that over the period January 2005 to June 2011 (by the way, the results are pretty much the same if you do it January 2005 to January 2011) the London area, Windsor-Sarnia, and the Northwest all saw overall drops in employment. The biggest percent age employment increases were in the Toronto area and Kitchener-Waterloo-Barrie (K-W-B) areas.

What might this mean for the October election? Well, Ontario is recovering quite nicely from the recession but the recovery is uneven. The areas that are doing the best - Toronto, K-W-B followed by Ottawa and the Muskoka region might be more forgiving of the governing party when it comes to the ballot box. The areas with slower employment growth (Hamilton-Niagara, Stratford-Bruce, the Northeast) and especially the negative employment growth areas may be more receptive to messages from the opposition parties. It will be interesting to see what the seat distribution looks like by these same regions after the election.
- Jul 22, 2011 Posted By: Livio Di Matteo Tags: horwath, hudak, mcguinty, ontario election, schreiner, twitter
Well, it is almost the end of July and I thought I would take a look at how Ontario's provincial party leaders are doing with respect to their number of Twitter followers. On my June 30th post, in the wake of poll results showing Tim Hudak's Progressive Conservatives with a commanding lead, I decided to see if this lead was also being replicated in the new social media via the number of Twitter followers each provincial party leader had. Dalton McGuinty had the most Twitter followers on June 30th despite the polls.
The number for June 30th, July 14th and July 22nd are presented below in a bar graph and they show that all four party leaders are exhibiting growth in the number of Twitter followers though the largest number of followers still belongs to Dalton McGuinty, followed by Tim Hudak, then Andrea Horwath and finally Mike Schreiner.

However, they are growing in such a balanced fashion that the distribution remains unchanged from June 30th. As the accompanying pie charts show, Dalton McGuinty still has 45 percent of the Twitter followers, with Tim Hudak next still at 31 percent and Horwath and Schreiner still at the same shares.

At this point, it would appear that none of the leaders have done anything significant to attract followers at a differential rate. It is still early in the election and more importantly it is July. While the temperature has heated up, the election race itself is still pretty cold. Will keep you posted on changes as they unfold.
- Jul 20, 2011 Posted By: Livio Di Matteo Tags: health expenditure, health outcomes, worthwhile canadian initiative
One of my areas of research is health expenditure and the release of new data is always an opportunity to do some exploring. I took a look at the new OECD Health Data 2011 release and it sparked some exploratory empirical work to see if health outcomes are related to the funding share of the health system done privately. I did some regression work and the results are posted in my most recent post on Worthwhile Canadian Initiative. Enjoy.
- Jul 20, 2011 Posted By: Livio Di Matteo Tags: economic transition, economy, employment, population, recovery, thunder bay
There seems to be a lot of conflicting opinion and evidence on how well Thunder Bay is doing economically. The most recent thrust of poor news is from the CIBC July 18th Metro Monitor’s economic snapshot of Canadian cities. The CIBC Metropolitan Activity Index for first quarter 2011 shows Thunder Bay as one of only three Canadian cities with a negative activity measure – along with Saint John and Saguenay. A number of variables go into this index and according to the CIBC’s calculations, Thunder Bay is doing particularly poorly in the areas of population growth, employment creation, the proportion of employment that is full-time, business bankruptcies, housing sales and non-residential building.
This seems at odds with how the economy actually seems to be doing in Thunder Bay. It is true that Thunder Bay (and the surrounding region) lost a lot of employment over the last decade but employment has stabilized though it actually has not grown much over the last couple of years. From a peak of average monthly employment of about 66,000 in 2003, employment declined to about 59,500 by 2009 and is currently averaging 58,100 for the first six months of 2011. Thunder Bay has yet to recover the employment losses of the last decade and much of the new employment created is part-time contract work interpreting some of the figures from the CIBC report. At the same time, there is visual evidence of robust economic activity in terms of construction activity on the public sector side (new courthouse, DSSAB building, waterfront) as well as the private sector side especially in terms of new hotel and retail construction and yet employment figures do not appear to be picking this up. As well, the most recent numbers for non-residential building permits (see my recent blog post) see a healthy increase for Thunder Bay. Again, where is the associated employment creation?
Another positive indicator comes on the population side. According to the just released Statistics Canada Report on the Demographic Situation in Canada Thunder Bay is seeing population growth with much of it due to sub-provincial migration – that is migration within Ontario to Thunder Bay. As of July 1, 2010, Thunder Bay’s CMA population was 126,683, which represents a substantial increase since the 2006 census figure of 122,907 – an increase of 3 .1 percent. Essentially, Thunder Bay’s population has actually been growing at just under 1 percent a year since 2006. The decline due to natural increase and interprovincial migration has been more than offset by both international migration as well as sub-provincial migration. In other words, people are moving to Thunder Bay from within Ontario (my best guess there is that it is mainly from the surrounding region) as well as from other countries. This latter point is actually excellent news given that international migration to the city appears to have dried up after the 1970s. A new wave of immigrants will bring fresh perspectives and opportunities to the city.
Thunder Bay thus represents an economic paradox. On the one hand, population is growing and there is a plethora of construction activity and a growing hotel and retail sector and yet total employment remains stagnant. What is going on? If Thunder Bay’s population is growing, its economy transitioning and breaking new ground, why is it not creating large employment gains?
At best, one can hypothesize about some of the trends that might be going on. One of the first things the New Policy Institute we have been promised by the provincial government can do is start collecting more detailed micro-level data on the regional population and economy. Until then, here are some of the possibilities.
First, there is migration from communities hard hit by the forest sector into Thunder Bay and based on the average age profile of the forest sector prior to its collapse, many of these individuals are probably either retired or semi-retired and not always by choice given their resource sector skill sets. Indeed, there has been a withdrawal from the labor force (it has shrunk too) which is why local unemployment rates are so favorable compared to the rest of the country despite the drop in total employment.
Second, there is migration from the First Nation’s population around Thunder Bay into the city and a high birth rate and since much of this population is very young, it is going to be in school rather than in the work force. One way to corroborate this would be to find out if the First Nation's share of enrollment is growing in our local school boards. However, expect this to also change over the next decade as the First Nations population begins to age.
Third, while overall employment remains flat with jobs being both created and lost, the small growth that there is in knowledge economy jobs is largely being filled by migrants to Thunder Bay both from within Ontario and from outside the country. Essentially, there is a shortage of skill sets in some of the critical technical and scientific fields that are driving the local knowledge economy. This should be a hint to parents as to what they might want to encourage their children to study in college and university.
Fourth, even in those sectors that are quite active –such as construction – it is possible that much of the demand is seen as short run and is being met by overtime work rather than a lot of new hires. If the construction sector’s activity is sustained over time, one can eventually expect firms to commit to more hiring. Indeed, the June 2011 Thunder Bay Ventures Report suggests that hiring intentions for the next year are up.
Finally, there has been some downsizing underway in the provincial public sector over the last six months and even though the job losses have not been widely publicized, perhaps these have also had some impact on local employment creation given the dependence of the local economy on public sector employment.
While the indicators at this stage seem conflicting, that is to be expected given the economic trauma of the last decade and the slow process of recovery and transition. Employment is not always a leading indicator but if there is indeed a sustained economic recovery underway in the city and region, one can expect to eventually see employment levels pick up. For the time being, we seem to have a jobless recovery.
- Jul 18, 2011 Posted By: Livio Di Matteo Tags: duluth, economic activity, population, thunder bay
Thunder Bay residents flock to visit and shop in Duluth, Minnesota and continually remark how robust and vibrant Duluth's waterfront and downtown area is when compared to Thunder Bay. This appears to be all the more surprising given that the population of the city of Thunder Bay - at about 110,000 people - is much larger than the city of Duluth, which stands at about 86,000. One can point to the fact that much of Duluth's visitation and tourism actually comes from nearby Minneapolis-St. Paul (a two hour drive) which has a population of nearly three and a half million people as well as from Wisconsin.
However, this is only a partial explanation given that downtown and waterfront areas are not only a tourism attraction but are also a focus for your own community's activity. The fact is, Duluth is a much larger "community" than Thunder Bay when the population of the surrounding St. Louis, Carlton and Douglas counties - the Duluth metropolitan statistical area - is considered. There are nearly 280,000 people living in the broader Duluth area as compared to about 125,000 in the immediate Thunder Bay vicinity or census metropolitan area. Basically, the Duluth area has 2.2 times the population of the Thunder Bay area and as a result can support a much denser downtown core and waterfront area even without visitors from Minneapolis-St. Paul (and Thunder Bay). Even if one compares the geographically large Duluth MSA with the larger Thunder Bay District's population of 149,000, there is still a substantial difference in the population of the nearby regions.
The accompanying figure plots population for the two cities and their immediate vicinities for the period 1970 to 2010. One other thing to note, whereas Thunder Bay's CMA population has essentially stagnated since 1990, the Duluth MSA has actually seen some noticeable growth. Since 1990, the Duluth MSA population has grown by almost 4 percent whereas Thunder Bay's CMA population has shrunk by about 1.5 percent. The implications? When it comes to fostering economic activity, population size does matter.

- Jul 18, 2011 Posted By: Livio Di Matteo Tags: federal-provincial relations, federalism, transfer payments
Winnipeg Free Press - PRINT EDITION
Time for provinces to grow up
By: Livio Di Matteo
Posted: 07/18/2011 1:00 AM
Next week, Canada's provincial premiers will meet in Vancouver. With provincial elections looming this fall for half of them -- Saskatchewan, Manitoba, Ontario, Newfoundland and Labrador and Prince Edward Island -- one can expect little of substance occurring aside from photo ops and the perennial plea for more federal cash.
With the cash escalator of the Health Accord expiring in 2014, expect to see some manoeuvring on how to leverage more money from the federal government.
Yet, any provincial plea for more cash comes at a time when they have become the dominant fiscal tier in the Canadian federation.
In 1961, the estimated total tax revenue the provincial local sector took in -- excluding federal transfers, investment income and sales of goods and services -- was $3.8 billion, as opposed to $6.1 billion by the federal government.
By 2009, the provincial local sector was raking in $243.5 billion in tax revenue and the federal government $196.8 billion.
This represents a remarkable shift in the Canadian federal balance. Between 1961 and 2009, total provincial local tax revenues grew at a rate of 8.7 per cent annually, while those of the federal level have grown at 7.2 per cent.
The change in fortunes is also highlighted when tax revenues are compared to GDP. The federal tax revenue-to-GDP ratio fell from 14.7 per cent in 1961 to 12.9 per cent in 2009, while the equivalent ratio for the provincial local sector rose from 8.6 per cent to 18.3 per cent.
The fact is the provinces and their creatures -- the municipalities -- have become the dominant fiscal tier.
Yet, whenever the premiers gather, it is like adult children coming home to visit their parents and then quickly reverting to the grievances and behaviour of their early childhood.
Despite the fact the federal government still provides them with about 20 per cent of their total revenue and their combined tax revenues actually exceed that of the federal government, the provinces nevertheless inevitably clamour that they are the junior partners in the federation and their needs require yet more assistance.
This year's interactions between Ottawa and the provinces will likely mark a watershed. After a period of minority government, majority government is back, which means it can be assertive in terms of the direction it wishes to take the federal-provincial relationship.
There is some indication that the philosophical underpinning of the Harper government accepts the new status of the provinces and acknowledges their fiscal power as the dominant tier.
With power, however, comes responsibility, and Ottawa will likely see to it that the provinces accept more responsibility for their program expenditures, particularly in the area of social spending and health.
Based on its past actions in areas such as infrastructure and stimulus spending, the Harper government likely sees the role of the federal government not as an endless social transfer agency practising chequebook federalism but as a co-ordinator of the Canadian economic union.
The Martin government was comfortable with the role of the federal government as a social investor and it increased spending on social programs, especially health.
The Harper government seems to view the federal role more as traditional nation-building via spending on defence, Arctic sovereignty and infrastructure at both the provincial and municipal level.
In essence, the Harper government has a classical economic view, which it may increasingly apply to federal provincial relations.
In classical economic thought, the role of government is to provide a basic system of law and infrastructure for the state to enable private individuals to pursue their self-interest within a free market. Government is a night watchman.
Applied to federalism, Ottawa is the night watchman of the Canadian federation, providing a national framework of infrastructure and institutions within which the provinces will pursue their self-interest and structure their social programs. Ottawa will provide a core transfer of resources, but beyond that, the provinces will decide their own patterns of health and social spending, facilitated where possible with federal data-gathering and research to provide information.
The provinces will be treated as grown-ups who must go forth and make their own way in the world.
Livio Di Matteo is a professor of economics at Lakehead University.
Republished from the Winnipeg Free Press print edition July 18, 2011 A11
- Jul 15, 2011 Posted By: Livio Di Matteo Tags: economy, non-residential construction, recovery
Statistics Canada has released its 2011 second quarter results for investment in non-residential building construction which includes the categories of commercial, industrial and institutional construction. Investment in non-residential building construction remained at $11.2 billion in the second quarter, edging up 0.1% from the first quarter after growing 1.7% on average in the five previous quarters. Gains in commercial and industrial building construction were offset by a decline in the institutional component. When combined with another release showing manufacturing sales down in six provinces, it would suggest that the economic recovery is progressing but still somewhat fragile. The accompanying figure below suggests that non-residential construction has yet to surpass the pre-recession peak in 2008.

The results for the Canadian census-metropolitan areas show that relative to the first quarter, investment was up in 18 of the 34 census metropolitan areas. St. Catharines–Niagara and Toronto posted the largest gains, mainly as a result of higher spending on institutional projects. Statistics Canada reports the largest declines occurred in Edmonton and Saskatoon, as a result of decreases in the institutional and commercial components.
What is also interesting is the results from second quarter 2010 to second quarter 2011 – that is, the annualized results. Across the 34 CMAs, non-residential building construction rose from 7.916 to 8.240 billion dollars - an increase of 4.1 percent. On an annual basis, growth was lowest in Peterborough, Trois-Rivieres and Barrie and the highest in St. Catherines-Niagara, St. John’s and Thunder Bay. Canada's CMAs are ranked from highest to lowest annual growth in the accompanying figure.

- Jul 14, 2011 Posted By: Livio Di Matteo Tags: election, northern development, ontario, policy advice, tim hudak
Ontario PC Leader Tim Hudak is in Thunder Bay today and along with an appearance at The Hoito will also be addressing a luncheon being sponsored by the Thunder Bay Chamber of Commerce. According to the most recent poll by Ipsos-Reid, Mr. Hudak's Conservatives hold an 11 point lead over the Liberals overall but have even stronger support outside of the GTA. Even Northern Ontario apparently has Mr. Hudak in the lead. However, it is only July and the election is not until October and given the voting tradition in the North, red and orange rather than blue are the usual autumn colours. Perhaps, Mr. Hudak will prove them wrong. Nevertheless, internal party polling must have revealed this trend earlier, which is why this week also saw more aggressive Liberal ads attacking Tim Hudak.
Mr. Hudak, should he become premier, will certainly have his hands full given Ontario's productivity challenge, Ontario's infrastructure challenge and Ontario's fiscal challenge. Moreover, there is also Ontario's northern economic development challenge. What policy suggestions would Northern Economist like to leave with Mr. Hudak?
First, Tim Hudak should enthusiastically embrace the North. The North is 90 percent of Ontario's land mass and is a storehouse of minerals, forest resources and hydro-electricity that can represent an investment frontier for Ontario in the 21st century. Mr. Hudak should become an advocate and salesman for northern Ontario economic development both at home and abroad. The North is not a problem, it is an opportunity for all Ontario but solutions require imagination rather than one-size fits all policies.
Second, Ontario and the Federal government together should set as their ambitious goal the four-laning of the Trans-Canada highway through all of northern Ontario by 2020. Such an ambitious infrastructure project will generate substantial economic activity and the improved transport corridor will generate long-term commerce and trade throughout the North. Such a corridor will also complete the vital east-west zone of highway transit for the Canadian federation. If this is too ambitious a proposal, I can live with completely four-laning the highway from Nipigon to Shabaqua, which would eliminate much of the potentially troublesome bottleneck that has all of the east-west traffic of the country going over just one bridge at Nipigon.
Third, the province should explore the creation of northern tax incentive and trade zones to spur economic activity and attract investment. These incentive zones are especially crucial in border areas immediately adjacent to the United States such as Sault Ste. Marie, Thunder Bay and Kenora. This is not special treatment but recognition of the economic challenges that more remote border regions with low population density face when trying to generate economic activity.
Fourth, the provincial government should allow the North to operate its own regional electric power grid through a regional power authority. The North is blessed with thousands of megawatts of potential hydroelectric power that is cost-effective, sustainable and not a contributor to greenhouse gases. A regional power authority could become a valuable tool for northern development and provide the cheap electricity for value-added processing and development necessary for mining in the Ring of Fire.
Finally, the province should allow the North to take on more responsibility for its economic development and foster institutional change to bring about more regional autonomy in the areas of energy, environment, transportation, economic development and resource management. Indeed, the creation of new hydroelectric corridors in the North could fall under the auspices of either a regional government or a new regional development authority. Moreover, a regional authority could also open up access to crown lands for cottage and recreational development. To date, crown lands have been administered as if they are as scarce as in the more populated South.
- Jul 14, 2011 Posted By: Livio Di Matteo Tags: autonomy, first nations, northern ontario, ring of fire
Shawn Atleo, the National Chief of the Assembly of First Nations (AFN) wants to repeal the Indian Act (enacted in 1876) and completely transform the relationship between Ottawa and the First Nations. Atleo has called for the replacement of the federal Aboriginal Affairs department with a new body that would deal with First Nations on a government to government basis. In essence, this appears to be a call for autonomy though the exact details of what these new institutional arrangements might entail have yet to be worked out. Institutions are the arrangement that people have for dealing with one another - cooperating and competing - and are innovated when the perceived net benefits to a society are positive. More autonomy for First Nations could represent not only a benefit for First Nations but also for Canada as a whole.
This could be a remarkable transformation of the Canadian federation. Provincial governments currently deal with Ottawa on a government to government basis but within the framework of the Canadian federation. They have separate and concurrent powers with Ottawa and raise their own revenues as well as receive transfer payments. Is Atleo proposing a First Nation province within which reserves and bands would then have an internal status somewhat akin to municipalities within provinces? This would be a major constitutional undertaking that along with mobilizing hundreds of First Nations across the country, would also require resolutions passing in two-thirds of provincial assemblies representing at least 50 percent of the population. Or is Atleo proposing a new quasi-autonomous federal governmental organization to take the place of Aboriginal Affairs with a new set of roles and responsibilities?
Here in Northern Ontario, where there have been perennial calls for more regional autonomy as well as provincial status, this opens up a whole new dimension on the regional autonomy issue. Could a First Nations regional government be established with jurisdiction over the lands currently held by the First Nations? Would their land base or jurisdiction be augmented to also incorporate what are considered traditional lands? What would such a government look like and what would it do? Would it have jurisdiction over natural resources? Health care and education? This could certainly have implications for economic development in the Ring of Fire as well as mining development in general. It might however also provide a mechanism for resolving some of the impasses that have developed between mineral companies and specific First Nations by granting First Nations more specific jurisdiction over development on their lands. With more power also comes more responsibility as self-governance and autonomy means taking ownership not just of entitlements and rights but also implementing the tools to promote your own welfare.
All in all, this is fascinating stuff and quite possibly could become the defining constitutional and social event of the 21st century for Canada. It will be interesting to see what the plan actually is.
- Jul 14, 2011 Posted By: Livio Di Matteo Tags: canada, hauser's law, united states, worthwhile canadian initiative
Economics has a number of “Laws” floating around that are rooted in empirical observation and then put forth as natural inexorable systemic laws. For example, in public finance, there is Wagner’s Law of Expanding State Activity, which links the size of the public sector to income. In health economics, there is Roemer’s Law, which basically states that a hospital bed built is a bed filled – a supply creates its own demand statement for health care. And most recently, there has been popular reference to what is known as Hauser’s Law in response to the U.S. debate over resolving its fiscal deficit. Hauser’s Law was formulated by W. Kurt Hauser of the Hoover Institute about 20 years ago and basically states that no matter how aggressive the tax regime, federal tax revenues as a share of GDP in the United States since 1930 have averaged just under 19 percent. I discuss Hauser's Law using American as well as Canadian data in my latest post on Worthwhile Canadian Initiative.
- Jul 12, 2011 Posted By: Livio Di Matteo Tags: balance, canada, federalism, revenues
It is quite remarkable how over the last half century, Canada's provinces have grown in fiscal power to the point where they are now the dominant fiscal tier in the Canadian federation. Nowhere is this more evident than when looking at the ability to raise tax revenues. In 1961, the total tax revenue taken in by the provincial local sector – excluding federal transfers, investment income and sales of goods and services – was 3.8 billion dollars as opposed to 6.1 billion by the federal government. By 2009, the provincial local sector was raking in 243.5 billion dollars in tax revenue and the federal government 196.8 billion dollars. This represents a remarkable shift in the Canadian federal balance. The change in fortunes is even more starkly highlighted when tax revenues are compared to GDP. The federal tax revenue to GDP ratio fell from 14.7 percent in 1961 to reach 12.9 percent in 2009 while the equivalent ratio for the provincial local sector rose from 8.6 percent to 18.3 percent. As the accompanying figure shows, the federal tax revenue to GDP ratio has stayed remarkably stable since 1961. That of the provincial local sector on the other hand grew dramatically between 1960 and 1990 though it declined slightly in recent years. Keep in mind that these are just tax revenues and do not include investment income, income from the sale of goods and services and transfers from other levels of government.

- Jul 12, 2011 Posted By: Livio Di Matteo Tags: crime, measurement, thunder bay
Is crime in Thunder Bay getting worse? That is an interesting question especially given the public perception that there is more crime in general and more violent crime in particular. One measure of violent crime is the homicide rate per 100,000 people. As Figure 1 shows, aside from the spike in 2009, there has been a downward trend over time on data available from Statistics Canada for the 1981 to 2009 period. The average homicide rate in the 1980s was 2.8 per 100,000 population in the 1980s and 2.9 per 100,000 in the 1990s but the first decade of the 21st century has seen a drop to 1.5.
However, homicides are not the only type of violent crime. Any crime that uses or threatens force is a violent crime. Figure 2 provides data using what Statistics Canada terms the Crime Severity Index, a relatively new statistical approach which constructs a measure of crime based on the severity of the criminal acts committed as well as their volume. For the period 1998 to 2009 are presented an overall crime index, a violent crime index and a non-violent crime index. The results show that the overall crime index declined since 1998 and has remained relatively stable. The same pattern appears to characterize non-violent crime. However, the violent crime index shows a decline from 1998 to 2003 and then an increase afterwards. Since 2003, the overall crime index in Thunder Bay has increased by 4.3 percent and the index for non-violent crime has declined 8.7 percent. However, the index for violent crime is up 43.7 percent. This represents a substantial increase and confirms the popular sentiment that the streets of Thunder Bay have become more mean and violent even if the average homicide rate is down.
Figure 1

Figure 2

- Jul 10, 2011 Posted By: Livio Di Matteo Tags: expensive, porter airline cities, taxi fares, thunder bay
Flying to Toronto and relaxing with Porter's inflight magazine, I could not help but have my attention drawn to the information provided on cab fares from airport to downtown for the various cities that Porter Airlines now serves. The cab fare from airport to downtown is provided for 14 cities as well as the distance from the airport to downtown. I've provided that information in the table below along with a calculation of cab fare in dollars per kilometer.

The first observation is that Thunder Bay is not the only city with a conveniently located airport relative to its downtown/central area. Boston, Chicago, Windsor and Toronto (Island) all have airports that are less than 10 kilometers from their downtown. The second observation is that in terms of the total fare paid to get from the airport to downtown, Thunder Bay ranks in about the middle with Toronto (Island) the lowest and New York (Newark) the highest. However, as the graph below shows, when you rank these cities in terms of cab fare per kilometer, Thunder Bay ranks the highest at about $5 per kilometer traveled.

The third observation is that Thunder Bay is definitely a very expensive city in which to take a cab - something that surely must rankle business and leisure travelers to our city. We are more expensive than Boston, Toronto, Ottawa and Chicago. I don't think it is because of our rugged northern terrain. Even other Northern Ontario cities - the Sault and Sudbury - are much cheaper in terms of dollars per kilometer.
- Jul 8, 2011 Posted By: Livio Di Matteo Tags: chsrf, conference, health, sustainability, toronto
I will be in Toronto this weekend to present at a pre-conference symposium being held by the Canadian Health Services Research Foundation (CHSRF). The symposium is an event being held in conjunction with the International Health Economics Association Meetings also being held in Toronto. The symposium is titled: Policy Options for the Financial Sustainability of Healthcare Systems in Canada and Abroad. I will be presenting an overview of a recently completed study on Canadian public healthcare sustainability titled "Diagnosing the fiscal viability of the healthcare system in Canada." Given the growing interest in the sustainability of public sector health care in Canada, this should prove to be a very interesting session full of ideas and am looking forward to the other presentations by national and international health economists. More when I get back.

- Jul 7, 2011 Posted By: Livio Di Matteo Tags: canada, new housing prices, northern ontario
In what could be an indicator of overall weakness in the regional economy of Northern Ontario, the latest results on new housing prices released by Statistics Canada show year over year declines in new housing prices for Thunder Bay and Sudbury. According to the release, the New Housing Price Index (NHPI) rose 0.4% in May following a 0.3% advance in April. Toronto and Oshawa as well as Montréal were the top contributors to the NHPI increase in May. As well, between April and May, prices increased the most in Regina (+1.7%) followed by Kitchener–Cambridge–Waterloo (+1.0%) as well as Toronto and Oshawa (+0.9%).
The graph below shows the year over year results. Statistics Canada reports that among the 21 metropolitan regions surveyed, 6 posted 12-month price declines in May, led by Windsor (-4.4%) and Victoria (-1.7%). Greater Sudbury and Thunder Bay saw decline but parts of the traditional manufacturing belt of Ontario also saw declines - such as London and Windsor. As usual, areas closest to the GTA - Hamilton & Oshawa - seemed to do well also given that they are spillover communities from the Toronto market.
All this of course adds new fuel to whether or not the housing market in Canada is overvalued and is poised for a bust. Of course, there is really no "Canadian" housing market per se but a series of regional ones scattered from east to west. There are declines in new house prices in some parts of the country but some of these are areas that are generally experiencing economic distress. An exception is the Ottawa-Gatineau region which being the capital region is traditionally insulated from the business cycle but which despite the year over year increases also apparently saw a drop in new house prices between April and May this year. Interesting to note that Vancouver also saw a drop in the new house price index.

23 Posts from July 2011
- Jul 6, 2011 Posted By: Livio Di Matteo Tags: fiscal crisis, gdp, growth, public debt, united states
With the August 2nd deadline for raising the United States public debt ceiling looming, it might be useful to take a longer-term view on exactly how bad the US debt situation is at least with respect to the past. I got U.S. public debt figures from 1790 to 2010 from the U.S. Treasury site. I got CPI (1982-84=100) and GDP for the same period from Economic History Services (EH.net) and combined with population data constructed two graphs: the debt to GDP ratio and real per capita public debt.
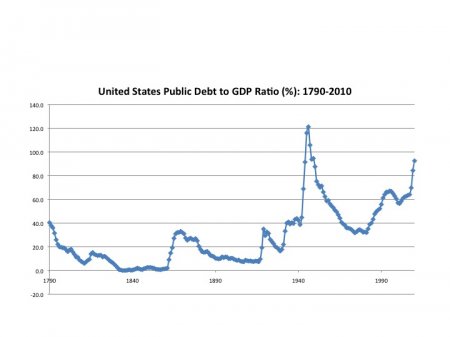

The results are interesting. At 92.5 percent of GDP, the US public debt is currently at its second highest point in history exceeded only by the Second World War period when the debt to GDP ratio hit 121 percent. However, the Second World War is a unique period and if one removes it from the picture, the current the debt to GDP ratio is the highest it has ever been. Aside from the Second World War and the immediate post-war era, the US public debt to GDP ratio was rarely above 40 percent. When real per capita debt is examined, the US public debt is now the highest it has ever been at about 20,000 dollars per capita in 1982-84 dollars. The current incline is part of increases that began in the mid-1980s reversing nearly 40 years of declining real per capita public debt after the Second World War.
What is interesting is that when you look at the annual growth rates of real per capita public debt, they were much higher in the nineteenth century. The average annual growth rate of real per capita public debt was 21 percent from 1790 to 1899 and about 5 percent from 1900 to 2010. The last five years however have seen some double digit increases in real per capita debt suggesting a shift in growth trends. Higher per capita debt growth is not unexpected in the 19th century given the United States was a young country with a vast frontier and lots of infrastructure to build. Road and railway building take a lot of money and the United States like many other countries provided government assistance for transportation and communication infrastructure.
However, accumulating large amounts of debt when your economy is rapidly expanding is quite a different situation from doing it when your economy is stagnating. That is the crux of the problem in the United States. The last three years in particular have seen a stagnant economy which has made the accumulation of large amounts of debt a more serious burden to the economy. In the short term, the US dilemma is dealing with the politics of raising the debt ceiling to avoid what could be a default on its debt. In the medium term, the United States has to raise government revenues as well as reduce spending to close the fiscal gap that is fueling the debt. In the longer term and most importantly, the United States has to start growing its economy again. This is its challenge for the 21st century.
- Jul 5, 2011 Posted By: Livio Di Matteo Tags: comparison, death rates, health, ontario, thunder bay region
Statistics Canada provides a lot of valuable data and it is interesting from time to time to gather some data and make some comparisons between where we live here in Northern Ontario and the province as a whole. I collected the data on the age-standardized death rates for the Thunder Bay District Health Unit region and for Ontario from the community Health Profiles site and the results show that generally speaking, death rates in the region are higher than Ontario for most diseases.
In terms of overall age-standardized deaths per 100,000 population (see table below), the number for the Thunder Bay District is 594.1 deaths while for Ontario it is 521.8 – about 14 percent higher. Once you start looking at the specific causes of death, large differences are present. For example, the colorectal cancer death rate is 20 percent higher, lung cancer death is 12.3 percent higher while death rates from heart disease, stroke and other circulatory conditions is 10.1 to 21.8 percent higher. Some exceptions are in the area of breast and prostate cancer death rates which are 39.2 and 7.5 percent lower in the Thunder Bay District compared to Ontario as a whole. Most disturbing is the accidental death rate - which is 42.3 percent higher in the District as well as the suicide rate which is 120.8 percent higher than Ontario's and the HIV death rate which is 144.4 percent higher.

Some of these differences can no doubt be attributed to lifestyle factors. For example, residents in the Thunder Bay District Health Unit Region relative to Ontario as a whole are more likely to be overweight, obese, smoke and drink heavily as well as consume fewer fruits and vegetables. Some of it could also be due to lower educational attainment in the region given the well known correlation between education, income and health status. Some of it could also be due to medical access. For example, 84.4 percent of residents in the Thunder Bay District Health Unit Region report a regular medical doctor whereas 91.1 percent of Ontarians do. However, there are actually more family physicians per capita in the Thunder Bay District relative to Ontario but there are also far fewer specialists. As well, for many procedures, rates are actually higher in the Thunder Bay District (eg. knee replacements, hip replacements) which can either indicate better access or more chronic problems. For example, arthritis rates are also higher in the region compared to Ontario.
In any event, the reasons for the higher death rates in the region are complex. Nevertheless, death rates are higher and one needs to ask if all factors for this difference have been accounted for and if everything possible is being done to address this situation? Is a higher death rate simply an attribute of living in the North along with climate and the wildlife? Is it a function of the resources being spent on our regional health care system, in particular the shortage of specialists? Is it a lifestyle choice given the tendency towards more smoking, drinking and overeating in the region? Is there something we can learn in how breast and prostate cancer is being handled in the region given the lower death rates there that can be applied to other conditions? How to reduce the death rate to reflect the rest of the province? Interesting questions for which I do not have answers.
<div class="statcounter"><a title="vBulletin analytics" href="http://statcounter.com/vbulletin/" target="_blank"><img class="statcounter" src="http://c.statcounter.com/6528705/0/aa6c5f8c/1/" alt="vBulletin analytics" ></a></div>
- Jul 1, 2011 Posted By: Livio Di Matteo Tags: fort william, housing bust, port arthur, real estate busts
Housing prices in Canada and the possibility of a burst housing bubble were back in the news during this past week. A report by Capital Economics said that housing prices in Canada could fall by as much as 25 percent over the next three years as a result of a loss in market fundamentals that include record levels of houshold debt and overvaluations relative to incomes. Of course, we probably think that housing busts are the kind of things that only happen in other places but they have happened in Canada in the past - the early 1990s in Toronto and Calgary come to mind. They have also happened in our more distant Canadian past on a scale that might surprise you. Indeed, housing busts also lie in the economic past of Thunder Bay.
I've been collecting estate files and wealth information for a number of years now and one of my data sets is annual probated wealth data for the Thunder Bay area over the period 1885 to 1930 and it includes the real estate valuations of the deceased's estate. This time period includes the wheat boom era that saw the growth of entire new cities in Western Canada and an associated real estate boom that came to a crashing halt after 1912. Prices were fueled by a speculative frenzy that was the result of the belief in cities like Regina, Winnipeg, and even Thunder Bay that they were all going to be the "Chicago of the North" and there was massive overbuilding as well as zoning of land that ultimately lay empty for years. Case in point - the Parkdale area just north of the Arthur Street Marketplace a.k.a. Thunder Bay Mall - it was originally zoned residential in 25 foot lots in 1907! It has only been the last decade that they finally started building houses there.
Using my data for the twin Lakehead cities of Port Arthur and Fort William I have constructed a Locally Weighted Scatterplot Smooth using STATA of real estate value per decedent versus year (1,645 individuals). The smoothing is done to highlight the long term trend in the value of real estate over this entire time period as using only the annual averages show a bit more variation.

As the Figure shows, the smoothed real estate value per probated decedent in the twin cities climbed from the mid 1880s and peaked in 1912. In 1890, the value of real estate was about 900 dollars per person - this rose to 4,400 dollars by 1912. Then came the bust, brought about by the tightening of credit and the war which dried up immigration and prices dropped - and continued dropping for a long time. There was a brief rally right after the war but the drop resumed and real estate per decedent bottomed out at about 2,800 dollars (remember, all these values are nominal - the drop looks even steeper if inflation adjusted dollars were used). From 1912 to 1925 - the value of real estate held per person fell by about 36 percent. Increases then resume after 1925 during the Roaring 20s but the data ends in 1930 and I suppose we can all guess what the Great Depression might have done to this rally. I also have a plot of the share of rw - total wealth held as real estate (done as a ratio of real estate to total wealth) and it shows an increase from 1885 to about 1905 - a plateauing at just over 45 percent during the boom and the First World War, and then a drop after 1920.

Anyway, it took a long time for the results of this housing bubble to work their way out of the local economy in Port Arthur and Fort William. The value of real estate dropped and stayed down for decades. At the Lakehead, it was not until the resource boom and baby boom of the postwar era that real estate values began to climb again. Anyway, the collapse of real estate values and the associated wealth effects are not a pretty process. A 25 percent drop over three years as predicted by Capital Economics has precedents in what has occurred in our own past.