17 Posts from March 2011
Twitter, The Federal Election & Thunder Bay
- Mar 30, 2011
- Posted By: Livio Di Matteo
- Tags: election, thunder bay, twitter
It is said that the current federal election is the first real
social media election and will be fought on the sites of Facebook and
Twitter as well as door-by-door campaigning. All the candidates
listed below have taken advantage of the internet in that they have a
web page presence with some information on their parties and
platforms. Another way to interact and campaign is via Twitter,
which with its 140 character messages seems ideally suited to the
attention span of modern politics. One way to assess the social
media profile of candidates to date in the federal campaign in our two
Thunder Bay Ridings is to look at their number of Twitter
followers. As of approximately 11pm on Wednesday, March 30, 2011,
the numbers looked something like this:
Thunder Bay-Superior North
Bruce Hyer (NDP) 385
Yves Fricot (LIB) 66
Richard Harvey (CON) could not locate on Twitter.
Scott Kyle (GRN) could not locate on Twitter.
Thunder Bay-Rainy River
John Rafferty (NDP) 1089
Ken Boshcoff (LIB) 137
Maureen Comuzzi-Stehmann (CON) could not locate on Twitter.
Ed Shields (GRN) 59
It is still early in the campaign but the incumbents in the two ridings currently appear to have the largest number of Twitter followers. A number of candidates could not be located on Twitter yet – either I was unable to find them or they have not set themselves up. If they are set up on Twitter and I have missed them, please let me know. I will check again in coming weeks to see whether they have Twitter sites. It will be interesting to see how the number of Twitter followers is correlated with the ultimate vote tallies if at all.
Ontario budget delays the pain
This article originally appeared in the March 30th edition of the Ottawa Citizen.
Ontario faces tough fiscal decisions, but Tuesday's provincial budget defers the day of reckoning. The political calculus of a looming fall election combined with the increased revenues from a slowly recovering economy will be used to make a token assault on the deficit. Any concerted attack on the deficit will likely not take effect until well after the election. More importantly, there was no credible long-term plan to address the province's net debt, which is expected to reach $285-billion by 2013-14.
Since 2000, the annual growth rate for provincial government expenditure in Ontario has averaged about 10 per cent, while revenue has grown at about six per cent annually. For the period 2010 to 2013, revenue is projected to grow about four per cent annually, while expenditure growth will slow to about two per cent. True, the recession and world financial crisis caused expenditures since 2007 to rapidly outpace revenues, and running deficits to stimulate the economy during a recession is a reasonable policy. However, while the economy will begin to improve and revenues rise, Tuesday's budget shows substantial deficits well into the future, feeding an ever-mounting provincial debt.
From a net debt of $157 billion in 2007, Ontario's net public debt rose to an estimated $242 billion in 2010, and it can be expected to surpass $300 billion in the very near future.
To be frank, there is plenty of blame to share regarding the state of Ontario's finances given that the debt has risen steadily from the mid-1960s, when it stood at a paltry $1.6 billion. Over the decades, deficits were incurred in bad economic times, but during the recovery balanced budgets rather than surpluses were the norm.
Additional revenues were used to boost spending rather than pay down debt. Governments have consistently lacked the long-term discipline needed to bring the public finances under control and the result is a higher debt with a deeper hold.
The reluctance to seriously address the debt in Ontario is rooted in the province's well-meaning political culture of investment and support for its citizens. It is important to provide public programs and services, and who wants to be seen as tight-fisted when revenues are rising? All governments have been proud of their investments in health and education and none more so than the current provincial government.
However, program pride generally goes before the fiscal fall. Increased spending on important programs such as health and education is motivated by the best of intentions, but the road to debt, like the road to hell, is strewn with good intentions.
Given that Ontario's net debt was about $130 billion in 2001, it means that about half of Ontario's net debt was acquired in just 10 years. Indeed, more than 80 per cent of Ontario's net public debt since Confederation was acquired in the 20 years since 1990.
A big driver in the historical growth of the debt has been the power of compound interest. Recent debt service costs in Ontario have only been as manageable as they are because of historically low interest rates with an effective interest rate on the debt of about four per cent. Yet, inflationary pressures in world commodity markets will eventually spark interest rate increases. An increase of one percentage point in debt servicing costs will easily add $2.5 billion to expenditures, making a balanced budget an ever more elusive target. Indeed, Tuesday's budget forecasts debt service will rise from $9.5 billion in 2010 to $12.6 billion in 2013 and to $16.3 billion by 2017.
A disciplined approach of restraining expenditure growth below the rate of revenue growth to generate regular and recurrent surpluses, which, after the budget is balanced, are applied to reducing the debt and its service costs is a preferable long-term option.
Deep spending cuts and austerity are painful.
However, given the manner in which government in Ontario has deferred dealing with the debt, the use of spending cuts becomes inevitable. Governments in Ontario live for the moment, spending revenue as quickly as it comes in and then, when faced by a brick debt wall, they embark on fiscal austerity as a quick fix causing immense pain through service and program cuts. It is undisciplined and irresponsible. Where is the pride in that?
Livio Di Matteo is professor of economics at Lakehead University and a contributor to Worthwhile Canadian Initiative, Canada's premier economics blog.
The Provincial Budget and the Northwest: What Can We Expect?
- Mar 26, 2011
- Posted By: Livio Di Matteo
- Tags: budget, deficit, economy, northwestern ontario, ontario
Well, another week and yet another budget – this time it will be
Ontario. Ontario has had a very difficult fiscal time of
late. With expenditures of over 126 billion dollars and revenues
just under 108 billion, the deficit stands at about 19 billion dollars
and the debt at almost 245 billion. This is not a recent
problem given the long-term trend in Ontario’s public finances that I
have documented in a recent post on Worthwhile Canadian Initiative.
Given the fiscal sustainability issues that it faces one might expect
that the provincial government will embark on a major austerity program
but that is probably not going to be case given that we are going into a
fall election. The provincial government will provide some very
stern rhetoric concerning the need for fiscal responsibility and
austerity but will likely use the increased revenues from a recovering
economy to make only a token assault on the deficit. A concerted
assault on the deficit may be announced but it will likely not take
effect until well after the election.
Delaying addressing the long-term sustainability of the province’s finances is not in the best interests of the tax-paying public. On the other hand, for the Northwest and Northern Ontario in general, this is likely to be relatively good news given the large role that government infrastructure spending and investment has played in stabilizing the regional economy in the wake of the forest sector crisis and the recession. For example, the Northwest has seen millions of dollars in provincial road construction and improvements announced or implemented as part of a planned $273 million investment in regional highways. For other evidence on provincial government spending in the Northwest, one only has to pick up the local paper and see the continual pre-election announcements by our local MPPs reminding us of how much has been spent on health, education and other programs.
What would be the things I would like to see in Tuesday’s budget specifically for the Northwest? Well, to start, the budget would be a good time to announce some specifics on the recently released Northern Growth Plan. Going beyond the rhetoric of the plan, what spending specifics is the government going to commit to? Given the commitment for an integrated transportation system does it mean more dollars for upgrading the provincial highway system to access the Ring of Fire? Will there be any specific tax changes for the North to “maximize” the potential of our resource development? Will there be new programs on aboriginal education and infrastructure?
Barring the growth plan, can we expect any movement at all on electricity prices for the region given the importance they have for the resource sector as well as planned future mining developments in the Ring of Fire. The province has also been committed to increasing the number of post-secondary education graduates in Ontario – how much extra funding will that translate into for Confederation College and Lakehead University?
On a more whimsical note, the province recently announced the closing of old jails and the construction of new money-saving cost-effective prisons in Toronto and Windsor. Given the high land prices in southern Ontario, what could be more cost-effective than building the new prisons in Nipigon, Atikokan or Terrace Bay? Given the Toronto-centric lifestyle of the average southern Ontarian, imagine the deterrence effect on criminal activity when word spreads criminals would be serving their prison sentence up North! Moreover, on windless days, these same prisoners could be used to manually turn the crank on all those windmills being built and help generate environmentally friendly energy and also keep fit.
Given the fiscal box the province is currently in, this budget may likely not offer substantial pre-election goodies. On the other hand, neither will there be any major expenditure cuts or program reductions. For the Northwest, this budget might be the fiscal equivalent of the Northern Growth Plan. This means we can look forward to our local MPPs announcing the same expenditures and initiatives over and over again in the six months leading up to the October election.
GDP & Population Shares, Natural Resources & Prosperity: A National Comparison
- Mar 24, 2011
- Posted By: Livio Di Matteo
- Tags: canada, economy, gdp, natural resources, population
Over the last thirty years, there have been substantial changes
in the Canadian economy and one of the changes is the evolving share of
output accounted for by each of the provinces. In my latest post
on Worthwhile Canadian Initiative,
I compare population and GDP shares for each of the ten provinces since
1981. The importance of natural resources is highlighted in this
post given the performance surge of Newfoundland and Labrador as well as
Saskatchewan. It would appear that "rocks and trees" are still
important.
Federal Budget & The Northwest
- Mar 22, 2011
- Posted By: Livio Di Matteo
- Tags: canada, federal budget, northwestern ontario
The release of the Federal budget this afternoon represents a
relatively cautious approach to dealing with the economy as well as the
prospect of a federal election. There are large numbers of credits
and programs that will appeal to many people as well as those of us
here in the Northwest. For example, there are incentives for rural
doctors and nurses, a family caregiver tax credit (cleverly borrowed
from the Liberals), an extension of the energy retrofit program,
enhanced GIS payments for seniors and even an arts tax credit for
children. This provides a generous base of policy options on which
to build an election campaign should an election campaign occur.
Specifically mentioned in the budget is the 4 million dollars for a
cyclotron to produce medical isotopes at the Thunder Bay Regional
Research Institute. This would certainly be a handsome addition to
the knowledge economy infrastructure of Thunder Bay. The budget
is also planning some revenue enhancements including closing up a tax
deferral loophole for corporations that will bring in about a billion
dollars a year and increases in EI premiums of 5 cents per 100 dollars
in 2011 and 10 cents in 2012. The EI premium announcement is a tax
increase and it will be interesting to see how the opposition reacts to
it. The deficit is slated to come in at 40 billion dollars for
2010-11 but it may likely be even smaller once the full tally for the
fiscal year is done. One interesting item of interest to
Northwesterners was the announcement of 150 million dollars to build an
all-weather road in the Northwest Territories. I suppose it would
have been nice to have had a similar announcement on roads in
Northwestern Ontario given the need for all-weather roads here as well
as the fact that the Trans-Canada in this region is not up to par with
the rest of the country. Also missing from the budget was any
serious in-depth discussion of how to deal with the long-term
sustainability of federal finances given rising health care costs and an
aging population. On the other hand, all the Federal parties are
currently living for the moment and are not going to focus on the far
future.
Will all this be enough to avoid an election? Independently of the contempt of Parliament issue, it might of been but listening to Jack Layton this afternoon it appears that we may indeed be headed for an election unless there are some last minute amendments to the budget to satisfy the NDP. Who wins from this budget? If there is an election, the Conservatives have a pretty good platform from which to campaign. The NDP and the Liberals will have difficulty campaigning on the economy and the budget. If there is no election, the Conservatives hang on to power for a bit longer and the NDP demonstrate that they can bring some gains to Canadians via their brokering role. The longer the minority government lasts, the weaker the Liberal hand gets given the difficulties Michael Ignatieff has been having in his leadership role. It is going to be an interesting week.
Will all this be enough to avoid an election? Independently of the contempt of Parliament issue, it might of been but listening to Jack Layton this afternoon it appears that we may indeed be headed for an election unless there are some last minute amendments to the budget to satisfy the NDP. Who wins from this budget? If there is an election, the Conservatives have a pretty good platform from which to campaign. The NDP and the Liberals will have difficulty campaigning on the economy and the budget. If there is no election, the Conservatives hang on to power for a bit longer and the NDP demonstrate that they can bring some gains to Canadians via their brokering role. The longer the minority government lasts, the weaker the Liberal hand gets given the difficulties Michael Ignatieff has been having in his leadership role. It is going to be an interesting week.
Thunder Bay’s Changing Age Structure & Population
- Mar 18, 2011
- Posted By: Livio Di Matteo
- Tags: age structure, economy, fertility, population, thunder bay
Thunder Bay’s population has been a source of some angst over the
years given that it has remained flat for several decades now while
other parts of the province and the country have continued to see
substantial increases. It has not always been that way as a glance
at Figure 1 shows. Thunder Bay has experienced periods of
extremely rapid population increase in the past. From a population
of only 503 people in 1871, Thunder Bay (then the twin cities of Port
Arthur and Fort William) grew to 6,847 people by 1901 and then had a
population explosion induced by the wheat boom that saw its numbers grow
to 27,719 in 1911 and then reach 35,427 by 1921 (Census of Canada is
the data source). Population growth continued but its pace picked
up during the post-war economic boom and population grew from 55,011 in
1941 to 108,411 in 1971 at the tail end of the post-war boom.
Population growth then slowed dramatically and rose only gradually to
peak at 113,946 in 1991 and then declined afterwards reaching 109,140 in
the 2006 census.
Figure 1

However, another less discussed feature of Thunder Bay’s population is its age distribution. That has also seen some remarkable changes over time as Figure 2 shows. The periods of economic boom have been accompanied by increased in-migration as well as high birth rates that generated a very youthful population. Periods of slow economic growth and stagnation, on the other hand have resulted in outmigration and an aging population structure. In 1921, at the end of the wheat boom era, Thunder Bay had 52 percent of its population aged 24 years or less. This was partly a function of the boom but also a reflection of the higher fertility rates and larger families of the time period. By 1941, at the end of the Great Depression, only 33 percent of the city’s population was under age 24. Similarly if one goes to the post-war boom period, by 1971, an amazing 45 percent of Thunder Bay’s population was aged 24 years or less. By 2006, after twenty years of slow economic growth and outmigration, only about 30 percent of the population was below age 24.
Figure 2

Population growth and age distribution reflects economic opportunity and the period since 1971 has generally been one of diminished opportunity, unlike the wheat boom era of 1891 to 1921 and the post 1945 natural resource and baby booms. A smaller population provides a less dynamic environment for entrepreneurship, economic activity and change but a less youthful one reinforces the tendency even more. In some respects, Thunder Bay has done remarkably well given that since 1990 total employment has remained relatively stable despite the slowdown. However, given the influx of youth and increased female labour force participation into the labour market from the post-war youth bulge, it has meant that not everyone was able to find a home in the local labour market. Many chose to go elsewhere. One can only imagine what Thunder Bay might look like today if employment opportunities had been available for all the young and they had remained and started families. This should reinforce our drive to ensure a successful knowledge economy transition and opportunities for the youth of today. While not everyone necessarily wants to stay, it is nice to afford them the choice.
Sustainable federal spending essential
- Mar 18, 2011
- Posted By: Livio Di Matteo
- Tags: deficit, economy, federal budget
This originally appeared in the Winnipeg Free Press, March 17th, 2011
by Livio Di Matteo
The political intrigue in Ottawa is
rapidly moving us towards an election, which means that the budget could
simply be a dramatic reading rather than a policy exercise. As a
result, the necessary steps to deal with the current federal fiscal
situation will be delayed many months.
In typical Canadian fashion, when faced
with an important economic challenge, we often choose to delay the
decision as long as possible and replace it either with a royal
commission, a discussion of democratic process and engagement, or a
statement of what constitutes Canadian values. Barring those diversions,
there is always the prospect of some other scandal emerging to divert
our attention.
The key question is whether federal
spending is sustainable; that is, does the increase in the resource base
match the increase in spending? An examination of data from the Federal
Fiscal Reference Tables for the period 1961 to 2009 suggest that
federal spending has been largely unsustainable for much of the last 50
years, except when there is a focused effort to rein it in as during the
fiscal restraint of the 1990s.
For the overall period from 1961 to 2009,
revenues grew at an average annual rate of 7.8 per cent compared to 8.3
per cent for program spending and 8.3 per cent for debt charges. For the
period 1961 to 1990, program spending was sustainable, given that it
grew at an average annual rate of 10.3 per cent as opposed to 10.8 per
cent for revenues. Total spending, however, was unsustainable because of
debt charges, which were growing at 15 per cent. The 1990s, because of
federal fiscal restraint, were actually a sustainable period as revenues
grew faster than program spending and debt charges.
Old patterns, however, reasserted
themselves after 2000 as revenue growth failed to keep pace with program
spending. The fiscal situation actually improved because of
historically low interest rates, which served to reduce debt service
costs and provided a generous fiscal dividend to program spending. Much
of this spending in turn was used to enrich transfer payments to the
provinces, especially in the area of health spending. This unsustainable
long-term pattern of finances is independent of the recent run-up in
spending resulting from the federal fiscal stimulus.
There is now a rather large fiscal deficit
that needs to be addressed before interest rates start to rise and the
power of compound interest takes effect. According to the Federal Fiscal
Reference Tables, the deficit in 2009-10 was $55.6 billion and for the
first nine months of the 2010-11 fiscal year, the deficit was $27.4
billion, which suggests that the final deficit for 2010-11 could be
about $35 billion or even less.
This is actually remarkable progress but
it is largely the result of increasing revenues due to an improving
economy. Indeed, personal income and corporate tax revenues have started
to recover quite nicely, along with the federal GST. Total expenditures
have remained fixed, which is in itself a form of restraint.
The risk in the current situation, aside
from a lack of focus due to the political diversion of an election, is
that with recovering revenues we may be lulled into believing that
federal deficits can be self-correcting. That is, simply freeze total
spending and let economic recovery carry us the rest of the way. This is
very tempting and would mean that Canada once again has gotten off
quite lightly in international terms from the ravages of the global
recession.
However, this will simply be business as
usual and will not address the long-term structural imbalance that has
caused federal spending overall to rise faster than its revenue base
over the last 50 years. We need to have a discussion as to how to
structure federal finances for the next 25 years so that revenue growth,
at minimum, matches expenditure growth so as to meet the rising program
needs of an aging population in areas like health, home care and income
support.
To date, Canada has indeed been extremely
fortunate in its ability to weather the global economic storm, but good
luck is not a long-term basis for fiscal policy. Ignoring a discussion
of federal finances because of short-term improvements in revenues and
economic conditions and expecting that we will continue to do well is
the ultimate federal fiscal fantasy.
Some Economic Underpinnings of the Arc of Protest
- Mar 16, 2011
- Posted By: Livio Di Matteo
- Tags: economics, middle east, north africa, protest
The Middle East and North Africa have been engulfed by a rising
tide of protest and revolt in an arc stretching from Tunisia to
Iran. For some thoughts on the economics underlying these
protests, visit my latest posting at Worthwhile Canadian Initiative. I have also posted below the data used for the graphs on the Arc of Protest which were obtained from the CIA Fact


Northern Economist for Premier?
- Mar 15, 2011
- Posted By: Livio Di Matteo
- Tags: economy, northwestern ontario, premier
From the pages of the Thunder Bay Chronicle-Journal...
The North understood
Tuesday, March 15, 2011
Norman Bowers
Thunder Bay
Another Plan for the North
- Mar 14, 2011
- Posted By: Livio Di Matteo
- Tags: economy, growth plan, northern ontario, policy
This originally was published in the Thunder Bay Chronicle Journal on March 12, 2011.
The release of the Northern Growth Plan is the latest installment in a long list of plans for Northern Ontario’s economic development stretching back now almost half-a-century. The Northern Growth Plan joins an esteemed list of contributions that include the Rosehart Report (2008), Embracing the Future (2002) and my personal favorite – Design for Development – which was released in the 1970s – and confused many people about what the provincial government actually had in mind for the North given its designation of Thunder Bay and Sudbury as “primate” growth centers.
The current plan is again the result of many years of work and consultation and is “a call to action and a roadmap for change” organized to provide policy direction for growth around six principles: (1) a globally competitive economy, (2) education and skllls for a knowledge economy, (3) aboriginal partnership, (4) networks of social, transport and communications infrastructure, (5) sustainable environment and (6) innovative partnerships to maximize resource potential. Really, who can argue with any of that? We all want a diversified economy, people who are healthy and educated, vibrant communities and a clean environment. What the provincial government might wish to explain is why all this is a plan that is “bold and visionary, while at the same time realistic and sustainable?” What is so bold and visionary about expecting what other parts of the province have had for decades?
The plan has a detailed checklist for short, medium and long-term actions that will require implementation and of course more planning including regional plans within the region. This is again more or less what we expect of provincial plans for Northern Ontario given a literature search of past plans. What is more telling of this plan is what is not specifically mentioned: nothing on tax incentive zones, nothing on a regional energy grid, nothing on regional government, nothing on ever completely four-laning of the trans-Canada highway.
The Northern Policy Institute was the one positive and tangible contribution of the plan given that they are going to back it up with 5 million dollars. However, on its own, it almost seems devalued given that there was nothing specific on energy prices, regional government or upgrading of the road infrastructure. Moreover, the mandate of the institute now seems to be not so much independent policy research but monitoring implementation of the plan. As well, the NPI was originally proposed in 2006 and it is now 2011 - five years later. Having brought the institute into existence a couple of years sooner might have generated some real meat for the Growth Plan and put us further ahead in regional policy development. Indeed, having addressed electricity prices a little sooner could have saved some of the mills and put the region a little further ahead in terms of employment too.
For whatever reason, the provincial government takes a very long time to address concerns in this region. The pattern is one of constant lobbying and reiteration of the same concerns over and over again, a multitude of plans, and then eventually after a number of years a small amount of movement on a point or two. That is not to say that there is no progress but it just takes a lot longer than it does in southern Ontario. Case in point: five million dollars to fund the Mowat Policy Institute at the University of Toronto was provided by the provincial government some time ago.
For us in the North, it appears that we need to spend a lifetime lobbying for small incremental changes and improvements and this can wear out the hardiest of individuals. Is it really any surprise that so many of us just decide to migrate out of the region? The process of getting the provincial government to facilitate change and improvement in the North is a process spanning generations – much like the building of a medieval cathedral. However, the end result for the medieval peasants and burghers who spent fifty to one hundred years laboring was a magnificent structure with spires soaring to touch the face of God. Until demonstrated otherwise, all we have is yet another plan.
Thunder Bay’s Fiscal Fantasy
- Mar 11, 2011
- Posted By: Livio Di Matteo
- Tags: city council, debt, fiscal affairs, taxes, thunder bay
The recent deliberations leading up to City Council’s approval of
the 2011 operating budget have focused mainly on expenditure items, tax
rates and water rates. Indeed, the approval of a 1.27 per cent
increase in the property tax rate coupled with a 14.3 percent increase
in water rates at a time when gasoline, food and electricity prices are
rising will inevitably cause some distress amongst the city’s citizens
but the public’s response has generally been quite muted. Obviously,
the rates are not high enough yet, which will only encourage our
municipal governors further next year.
What was most disappointing about the budget deliberations was of course the absence of any meaningful long-term discussions of Thunder Bay’s fiscal future given the erosion of the tax base, the growing residential tax burden and the rather large debt load the city has taken on. This debt load is likely to get much larger given the cost overruns on the waterfront park development as well as the proposed Multiplex project, which will inevitably also require some new municipal debt (that will in turn be used to “leverage” some federal and provincial contributions). While such construction projects create jobs, the benefits in terms of employment and company profits are short term while the debt tends to last forever.
Figure 1 below presents a chart on municipal debt per capita from the 2009 BMA Consulting Group Municipal Study for municipalities in Ontario with a population greater than 100,000 and ranks them from lowest to highest. The results show that Thunder Bay is finally ranked number one in something – the amount of municipal debt per capita, which in this report stood at $1,974 per capita. Debt per se is not a serious problem provided that there are reserves to counterbalance them and Thunder Bay’s municipal reserves are substantial – with the city ranking 8th highest among this same group of municipalities. However, at only $1,040 per capita at the time of this study, there is obviously a major fiscal gap here.
Figure 1

Can we deal with the situation by raising more revenue? Well,
revenues come mainly from property taxes, user fees and government
grants. Government grants are unlikely to see major increases over the
next few years given the provincial fiscal situation. As for taxes and
users fees, well they have already been raised a lot and indeed much of
the tax burden is now on the residential ratepayer given the erosion of
the industrial base. Indeed, if one compares property taxes for an
average bungalow in Thunder Bay to the other major Northern Ontario
cities, Thunder Bay has the highest. The 2009 BMA Group Municipal study
places those taxes at $2,991 for Thunder Bay, $2,939 for North Bay,
$2,727 for Timmins, $2,434 for Sudbury and $2,301 for Sault Ste. Marie.
City councilors and administrators will inevitably come up with many ingenious explanations about these comparisons that will focus on how unique or special our circumstances are, and that we are comparing ‘apples’ with “oranges”. Indeed, if one added up the frequency this fruit analogy was used by the City of Thunder Bay, one might think that Northwestern Ontario and not the Niagara peninsula was the fruit belt. The point is its time to deal with the long-term finances of the City of Thunder Bay before there is an actual fiscal crisis. One cannot acquire an ever larger amount of debt without there being consequences down the road. Thinking otherwise is simply a fiscal fantasy.
What was most disappointing about the budget deliberations was of course the absence of any meaningful long-term discussions of Thunder Bay’s fiscal future given the erosion of the tax base, the growing residential tax burden and the rather large debt load the city has taken on. This debt load is likely to get much larger given the cost overruns on the waterfront park development as well as the proposed Multiplex project, which will inevitably also require some new municipal debt (that will in turn be used to “leverage” some federal and provincial contributions). While such construction projects create jobs, the benefits in terms of employment and company profits are short term while the debt tends to last forever.
Figure 1 below presents a chart on municipal debt per capita from the 2009 BMA Consulting Group Municipal Study for municipalities in Ontario with a population greater than 100,000 and ranks them from lowest to highest. The results show that Thunder Bay is finally ranked number one in something – the amount of municipal debt per capita, which in this report stood at $1,974 per capita. Debt per se is not a serious problem provided that there are reserves to counterbalance them and Thunder Bay’s municipal reserves are substantial – with the city ranking 8th highest among this same group of municipalities. However, at only $1,040 per capita at the time of this study, there is obviously a major fiscal gap here.
Figure 1

City councilors and administrators will inevitably come up with many ingenious explanations about these comparisons that will focus on how unique or special our circumstances are, and that we are comparing ‘apples’ with “oranges”. Indeed, if one added up the frequency this fruit analogy was used by the City of Thunder Bay, one might think that Northwestern Ontario and not the Niagara peninsula was the fruit belt. The point is its time to deal with the long-term finances of the City of Thunder Bay before there is an actual fiscal crisis. One cannot acquire an ever larger amount of debt without there being consequences down the road. Thinking otherwise is simply a fiscal fantasy.
One Hundred Years of Building Permits at the Lakehead: 1910-2010
- Mar 11, 2011
- Posted By: Livio Di Matteo
- Tags: amalgamation, building permits, economic growth, economy, thunder bay
Investment spending is one of the most volatile components of
Gross Domestic Product and construction activity is a major component of
investment. Municipalities issue building permits for new construction
and alterations that fall into the categories of residential,
industrial, commercial and institutional construction. Building permits
are of value as a historical data series because they are a key
indicator of past levels and trends of economic activity via their
documentation of capital formation. Building permit data for the City
of Thunder Bay from 1970 to 2010 as well as the former cities of Port
Arthur and Fort William for the period 1910 to 1969 provides a time
series that gives us a fascinating snapshot of the ebb and flow of
economic activity in Thunder Bay.
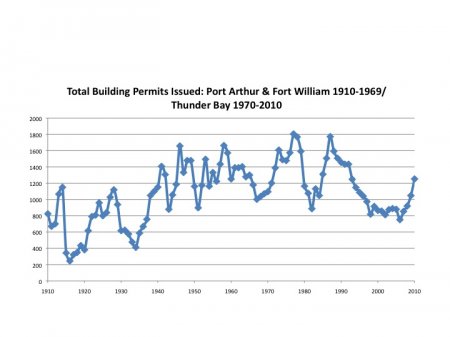
The three figures below show the total number of permits issued from 1910 to 2010, their real total value in 2002 dollars and finally their real value per capita calculated by dividing the real total value by the city’s population that year. From 1910 to the 1970s, despite cyclical business fluctuations, the total number of permits (Figure 1) generally rose and peaked in 1977 at 1,805. They then plunged sharply as a result of the 1981-82 recession, recovered and then began a long-term decline from the mid 1980s that only began to reverse starting in 2006. The large numbers of permits particularly in the 1960s and 1970s were fueled by residential permits as some years would see housing starts numbering 700-800 homes.
Figure 1

When the inflation adjusted total value of permits is presented (Figure 2), they show the period from 1910 to the mid 1930s to be one of intermittent growth and decline while the period from the 1940s to the mid-1970s one of increasing activity. The real total value of building permits issued peaks in 1975 at 273.5 million dollars ( in 2002 dollars) and then embarks on a long-term declined punctuated by the occasional upsurge. Both Figures 1 and 2 suggest that the 1970s was a watershed period in the economic history of the Lakehead for the period prior to that decade was one of growth in economic activity as well as population while the period since has been one of decline in economic activity and stagnation in population.
Figure 2

This pattern is also documented in the last figure, which plots the real value per capita of building permits (Figure 3). This figure again shows an increase in the real value of permits per person up until the 1970s and then a general decline afterwards – with one glaring exception being the years of the wheat boom from 1910 -1913. During those years, the largest per person values for permits are recorded with a peak value in 1912 of almost 4,000 dollars. This was at the height of the wheat boom era when the infrastructure of the Lakehead as the world’s largest grain port was being laid. In the years that followed, this dizzying height in per capita permit values was never matched and even the peak in 1975 only represents the third highest real per capita value in the years between 1910 and 2010.
Figure 3

The decline in economic activity at the Lakehead that commences in the 1970s is a function of many things such as increasing technological change in resource production that reduced employment in the resource sector, shifting grain markets that reduced the role of the port, and the end of the baby boom that then also ended the construction boom. Of course, one cannot also help noticing that the slowdown begins in the mid-1970s, right after the amalgamation in 1970 of the twin cities of Port Arthur and Fort William along with several of the adjoining townships. One cannot help but wonder if the intense urban competition and rivalry between the former cities of Port Arthur and Fort William was also a factor in spurring growth up until the 1970s. The elimination of that competition in the 1970s may have created an environment where new ideas and change were more difficult to implement because of the lack of jostling for advantage. The creation of a monopoly municipal government at the Lakehead may in the end have been yet another factor in the region’s long-term economic decline.
The three figures below show the total number of permits issued from 1910 to 2010, their real total value in 2002 dollars and finally their real value per capita calculated by dividing the real total value by the city’s population that year. From 1910 to the 1970s, despite cyclical business fluctuations, the total number of permits (Figure 1) generally rose and peaked in 1977 at 1,805. They then plunged sharply as a result of the 1981-82 recession, recovered and then began a long-term decline from the mid 1980s that only began to reverse starting in 2006. The large numbers of permits particularly in the 1960s and 1970s were fueled by residential permits as some years would see housing starts numbering 700-800 homes.
Figure 1
When the inflation adjusted total value of permits is presented (Figure 2), they show the period from 1910 to the mid 1930s to be one of intermittent growth and decline while the period from the 1940s to the mid-1970s one of increasing activity. The real total value of building permits issued peaks in 1975 at 273.5 million dollars ( in 2002 dollars) and then embarks on a long-term declined punctuated by the occasional upsurge. Both Figures 1 and 2 suggest that the 1970s was a watershed period in the economic history of the Lakehead for the period prior to that decade was one of growth in economic activity as well as population while the period since has been one of decline in economic activity and stagnation in population.
Figure 2

This pattern is also documented in the last figure, which plots the real value per capita of building permits (Figure 3). This figure again shows an increase in the real value of permits per person up until the 1970s and then a general decline afterwards – with one glaring exception being the years of the wheat boom from 1910 -1913. During those years, the largest per person values for permits are recorded with a peak value in 1912 of almost 4,000 dollars. This was at the height of the wheat boom era when the infrastructure of the Lakehead as the world’s largest grain port was being laid. In the years that followed, this dizzying height in per capita permit values was never matched and even the peak in 1975 only represents the third highest real per capita value in the years between 1910 and 2010.
Figure 3

The decline in economic activity at the Lakehead that commences in the 1970s is a function of many things such as increasing technological change in resource production that reduced employment in the resource sector, shifting grain markets that reduced the role of the port, and the end of the baby boom that then also ended the construction boom. Of course, one cannot also help noticing that the slowdown begins in the mid-1970s, right after the amalgamation in 1970 of the twin cities of Port Arthur and Fort William along with several of the adjoining townships. One cannot help but wonder if the intense urban competition and rivalry between the former cities of Port Arthur and Fort William was also a factor in spurring growth up until the 1970s. The elimination of that competition in the 1970s may have created an environment where new ideas and change were more difficult to implement because of the lack of jostling for advantage. The creation of a monopoly municipal government at the Lakehead may in the end have been yet another factor in the region’s long-term economic decline.
Northern Economist Joins Worthwhile Canadian Initiative
- Mar 10, 2011
- Posted By: Livio Di Matteo
- Tags: economy, ontario, worthwhile canadian initiative
I am delighted to join the team of Stephen Gordon, Frances
Woolley, Mike Moffat and Nicholas Rowe who post at Worthwhile Canadian
Initiative, Canada's major economic policy blog. I will be posting
economic policy pieces there as well as continuing to post more Northern
Ontario themed issues here at Northern Economist. As pieces appear on
WCI, I will also post links on this site so you can visit. My first
post on WCI: Is Ontario In Decline?
What’s Up With Charlie Sheen: Meltdown or Marketing?
- Mar 5, 2011
- Posted By: Livio Di Matteo
- Tags: charlie sheen, economic rents, marketing, meltdown, publicity
Charlie Sheen’s recent antics may seem
indicative of a meltdown but could they also have an economic
interpretation? At first glance, his outburst against the producers of
Two-And-A-Half-Men may seem to be an economically self-destructive
activity given that production on the show is now halted. The show was
apparently renewed and slated to run until 2011-12. However, that show
is now into its eighth season, which makes the ratings more difficult to
sustain (though the show has been performing very well), and given the
number of personal issues Mr. Sheen has been having over the last few
years the possibility of yet another season was becoming ever more
problematic. The recent meltdown and media rants have certainly
garnered Mr. Sheen an extraordinary amount of media attention and a rise
in his web presence (See the Google Trends graph below). If it looks
like you are not going to be able to sustain your activity for the next
couple of years due to rehab and other personal issues, why not pull the
plug now and try to cash out on the surge of celebrity. Notoriety can
also be a source of economic rents. In a sense, Mr. Sheen may be trying
to re-invent his career under the mantra that bad publicity is better
than no publicity at all. He is apparently trying to negotiate a 10 million dollar book deal and Charlie Sheen will get an animated special on U.S. cable network Spike TV called Charlie Sgheen's Winningest Monents that will premiere March 9 at 10:30 p.m. ET, on the U.S. cable network
Spike. Of course, there is no guarantee such a strategy will work but
borrowing from the immortal words of Mr. Sheen, if you are tired of
pretending you are not special, what else can you do? In Hollywood,
being special is what it is all about.
"Charlie Sheen" Google Trends Search

Is Federal Spending Sustainable?
- Mar 5, 2011
- Posted By: Livio Di Matteo
- Tags: canada, deficit, expenditures, federal government, revenues, sustainability
As budget season approaches, a quick survey of Canada’s long-term
federal finances is definitely in order. Figure 1 below plots federal
government revenues and total expenditures for the entire period 1961 to
2009 using data from the 2010 Fiscal ?Reference Tables. While the period from 1961 to the mid-1970s was largely balanced
budgets, the impact of the post-1973 oil price shock, productivity
decline, stagflation and high interest rates is demonstrated in the
widening deficit gap which is not closed until the restrictive fiscal
policies of the mid 1990s. The new era of budget surpluses lasts until
2008-9 when there is a 5.8 billion dollar deficit followed by 55.6
billion the year after.
Figure 1

As we move towards the March 22nd budget date, the question is whether federal spending is sustainable – that is does the increase in the resource base match the increase in spending? Figure 2 presents the average annual growth rates for federal revenues as well as program spending, debt charges and total spending. The results suggest that federal spending has been largely unsustainable for much of the last 50 years unless there is a concerted effort to rein it in as during the fiscal restraint of the 1990s. For the overall period from 1961 to 2009, revenues have grown at an average annual rate of 7.8 per cent compared to 8.3 percent for program spending and 8.3 percent for debt charges. For the period 1961 to 1990, program spending was sustainable given that it grew at an average annual rate of 10.3 per cent as opposed to 10.8 percent for revenues. However, total spending was unsustainable because of debt charges, which were growing at 15 per cent. The 1990s, because of fiscal restraint, was a sustainable period as revenues grew faster than program spending and debt charges. However, old patterns re-asserted themselves after 2000 as revenue growth has failed to keep pace with program spending. The situation has only not been worse because of historically low interest rates, which have served to reduce debt service costs. For another perspective on the federal fiscal situation focusing on expenditure and revenue composition, you might want to check out Stephen Gordon’s latest piece at Worthwhile Canadian Initiative.
Figure 2

Canada’s Evolving Export Sector: The Empire Strikes Back
Canada is usually referred to as a small open economy. The
evidence for this usually lies in the high export to GDP and import to
GDP ratios. Exports in particular are extremely important as they allow
us to earn a substantial portion of our income. Over the last thirty
years, the export to GDP ratio has averaged almost thirty percent, which
means that their absence would essentially amount to a 30 per cent pay
cut for the Canadian economy.
The two accompanying figures present a long-term perspective on our export sector. The first figure plots the export to GDP ratio from 1886 to 2010 (it is actually GNP rather than GDP for the period before 1975) using data from Historical Statistics of Canada and Statistics Canada. The results are intriguing as they document the rise of our export sector – particularly since 1960. Although Canada has always been an exporting nation, it was only with the First World War that Canada’s export to national income ratio rose above 20 per cent only to collapse with the onset of the Great Depression. The ratio again rises with the Second World War and then declines in the immediate post-war period but starting in the 1960s starts to climb peaking in the year 2000 at about 40 percent. Since the year 2000, Canada’s export to national income ratio has declined from this dizzying height to reach about 25 per cent. We appear to be back where we were before the onset of the Free Trade Agreement with the United States.
Figure 1

Figure 2 suggests that if we are to see a rise in the export to GDP ratio in coming years, we may have to look beyond the U.S. market. This is not necessarily a surprise as Canada’s trade patterns have shifted over time. The United Kingdom used to be the most important destination for our exports and that was eventually replaced by the United States. However, the last decade has seen the share of our exports going to the United States also decline – from a peak of 84 percent in 2000 to only 73 percent in 2010. This has been made up by an increase in exports to the UK (from 4 to 5 percent) and most significantly, to All Other Countries (from 12 to 22 per cent). Canada’s trade patterns appear to be diversifying away from the United States and we are now heading back to territory we last occupied in the mid-1970s. In 1975, the United States accounted for about 66 per cent of our exports, the UK had seven per cent and All Other Countries 27 percent.
Figure 2

Our exports dropped significantly in 2009 due to the impact of the recession but began to recover in 2010. The total value of Canadian exports in 2010 rose by 9.5 per cent. However, exports to the United States rose by 9.2 per cent while exports to Japan rose 9.5 percent and exports to the other OECD countries rose 9.9 percent. And as for the UK, exports to the UK rose by 36 percent in 2010! It would appear that when it comes to trade patterns for Canada, tomorrow is yesterday and the Empire has struck back. However, we will need to wait and see if this trend persists and the UK share of our exports returns to the levels of a century ago.
Obesity and GDP: Do Richer Countries Just Eat More?
Statistics Canada Daily has just reported on an article on the prevalence of adult obesity in
Canada and the United States. In the United States, the National Health
and Nutrition Examination Survey (NHANES) has been gathering measured
height and weight data for years. In 2007, the Canadian Health Measures
Survey (CHMS) began collecting direct measurements of height, weight,
body mass index (BMI), skinfolds and waist circumference from a
nationally representative sample of the population. The nature of these
surveys has created an opportunity to compare rates of obesity among
adults in Canada and the United States. The results show that from
2007 to 2009, the prevalence of obesity (defined as a BMI of 30 or
greater) in Canada was 24.1%, over 10 percentage points lower than in
the United States (34.4%). Among men, the prevalence of obesity was
over 8 percentage points lower in Canada than in the United States
(24.3% compared with 32.6%) and among women, more than 12 percentage
points lower (23.9% compared with 36.2%)
The interesting question is what may account for the difference? Is it lifestyle? Cultural preferences? Given the similarities between Canada and the United States, it is difficult to see what major cultural or lifestyle differences could account for such a difference. One major difference between the two countries is economic – the difference in per capita GDP. It could be differences in the material standard of living as captured by GDP affect the resources available for food consumption. However, the relationship between income, food consumption and obesity need not necessarily be positively correlated, as it would also depend on whether food is a normal or inferior good. Moreover, income and education are also correlated and it could be that countries with higher incomes have better educated populations and therefore are more knowledgeable about health and food consumption meaning the relationship between BMI and income could be negative rather than positive.
This relationship is checked out using health data for selected OECD countries: those for whom a recent estimate is available for both the percent of population that is obese - that is had a BMI greater than thirty - as well as per capita GDP. The per capita GDP is in U.S. purchasing power parity dollars. The results are presented in Table 1 for 14 OECD countries including Canada and the United States and are ranked by obesity. The United States tops the list at 27.5 percent of the population as obese while Italy is last at only 9.9 percent. When a graph (see Figure 1) with a trend line is plotted between income and the percent obese, the results show a negative relationship. That is, higher income is generally associated with a lower BMI – with one obvious outlier. The United States, with the second highest per capita GDP of these 14 countries (Norway was first) also has the highest percent of obese population and its data point is off on its own in the northeast corner of the graph. These results suggest that in general, the relationship between income and obesity at the national level is negative. The United States is definitely exceptional in being a high-income country with high obesity rates.
Table 1

Figure 1
